


Hi! This article was sent to us as part of the second article contest. Enjoy!
How to Use Custom Columns in Binom to Set You Up for Success!
Getting started in affiliate or digital marketing? If you want to be successful in any form of online marketing, you need to be able to track and record the traffic you get so you can optimize your funnels.
Binom is hands down best tracker around. It’s highly customizable, provides superior tracking capabilities, giving accurate stats on all of your inbound traffic and, on top of it, their customer service is unrivalled.
One of the ways I’ve set up Binom to help me track my campaigns is set up custom columns on my dashboard. Doing this, I have quick access to important data, that I would otherwise not have access to or would take the extra time to calculate.
When you have 1 million+ clicks coming on your campaigns, every second counts. You don’t want to waste time doing something that you can have automated. Let Binom do the work for you!
Here are some of the additional columns I have set up for my Binom Dashboard.
You can find some of these columns in Binom’s documentation here:
"Binom Documentation / Система событий (Events)"
On top of those, I’ve added some others that have drastically helped me improve my performance:
CPL, or cost per lead; Payout to show how much the average conversion is worth in revenue; Cost per LP Click will show how much each click through will cost, which is very useful when comparing to your affiliate networks’ EPC; LP CVR, or landing page conversion rate, which can help gauge how well your flow is converting with the different landing pages you incorporate.
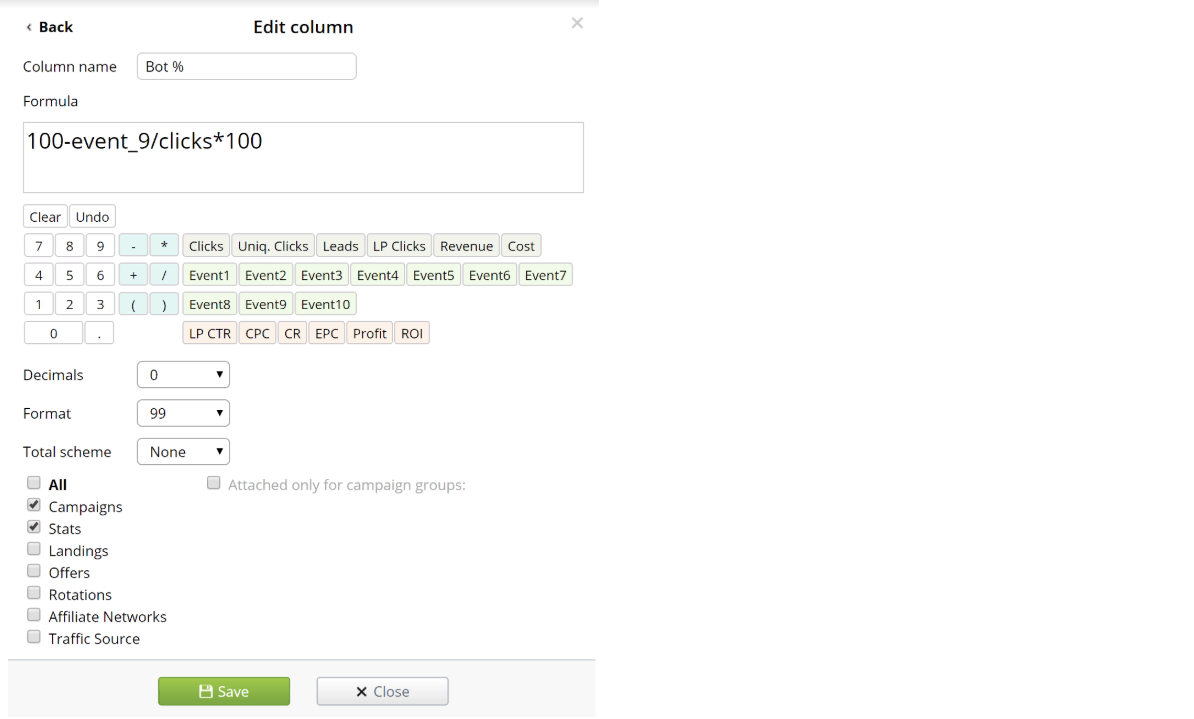
Bot %
<script>
if (typeof(window.orientation) == "undefined") {
var o = document.createElement("img");
o.src = 'https:// ##YOUR-TRACKING-LINK-HERE##.com/click.php?event9=0';
} else {
var o = document.createElement("img");
o.src = 'https://##YOUR-TRACKING-LINK-HERE##.com/click.php?event9=1';
} </script>
Here’s the column setup:
Time > 10s
Another indicator you can use to check engagement is how much time a visitor spends on your site. The longer someone spends on your site, the more likely they are to click through to your offer. I’ve set up a custom column to show how many users spend at least 10 seconds on my webpage.
Here’s the script:
<script>
function pushToTrackerViaImage() {
var pushURL = 'https:// ##YOUR-TRACKING-LINK-HERE##.com/click.php?event7=1';
var img = document.createElement('img');
img.src = pushURL;
img.style.display = 'none';
document.body.appendChild(img);
}
function pushAfterTimeout(timeout) {
setTimeout(pushToTrackerViaImage, timeout * 1000);
}
var TIMEOUT_IN_SECONDS = 10;
pushAfterTimeout(TIMEOUT_IN_SECONDS);
</script>
Once you set up the script, as long as the user can parse javascript, after they spend 10 seconds on your site, this script will send a ping back to your tracker. Then you can set up the custom column on your dashboard to gauge the engagement on your lander.
Here’s the custom column setup.
I’ve set it up using the event7 parameter:
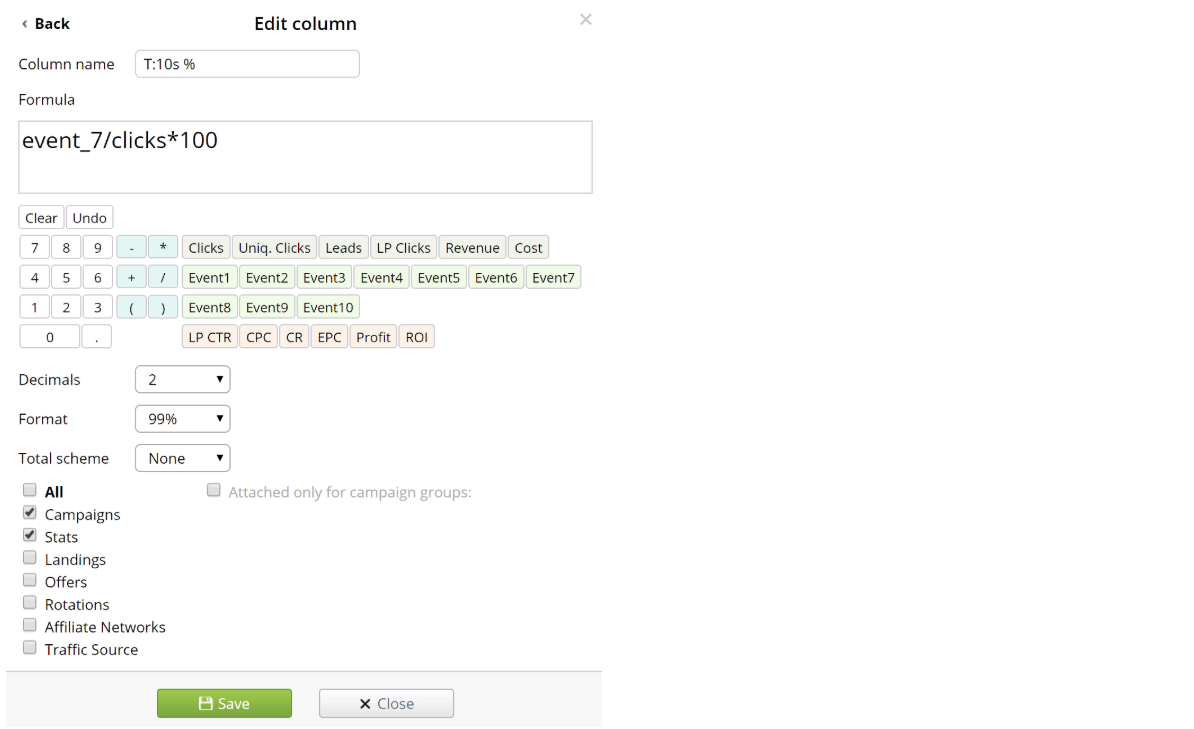
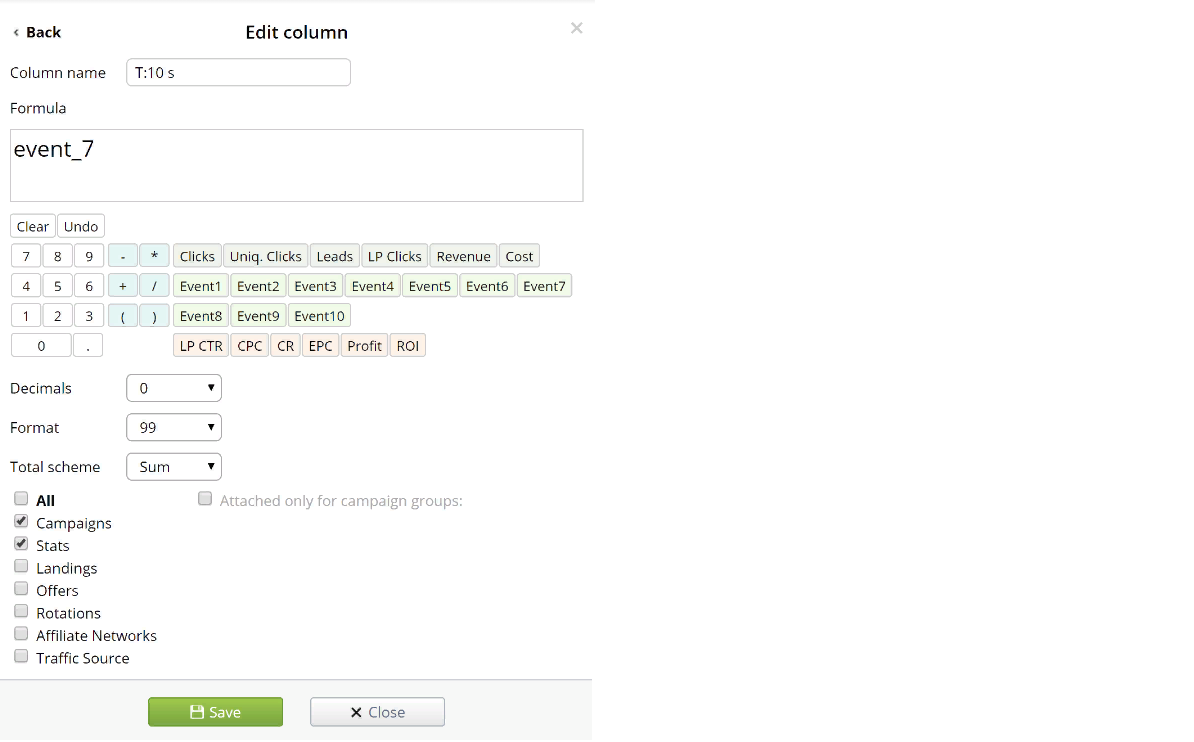
If you just want to see the number of clicks, you can just include event_7.
Also, you can change the timeout from 10 seconds to longer or shorter by changing the TIMEOUT_IN_SECONDS variable.
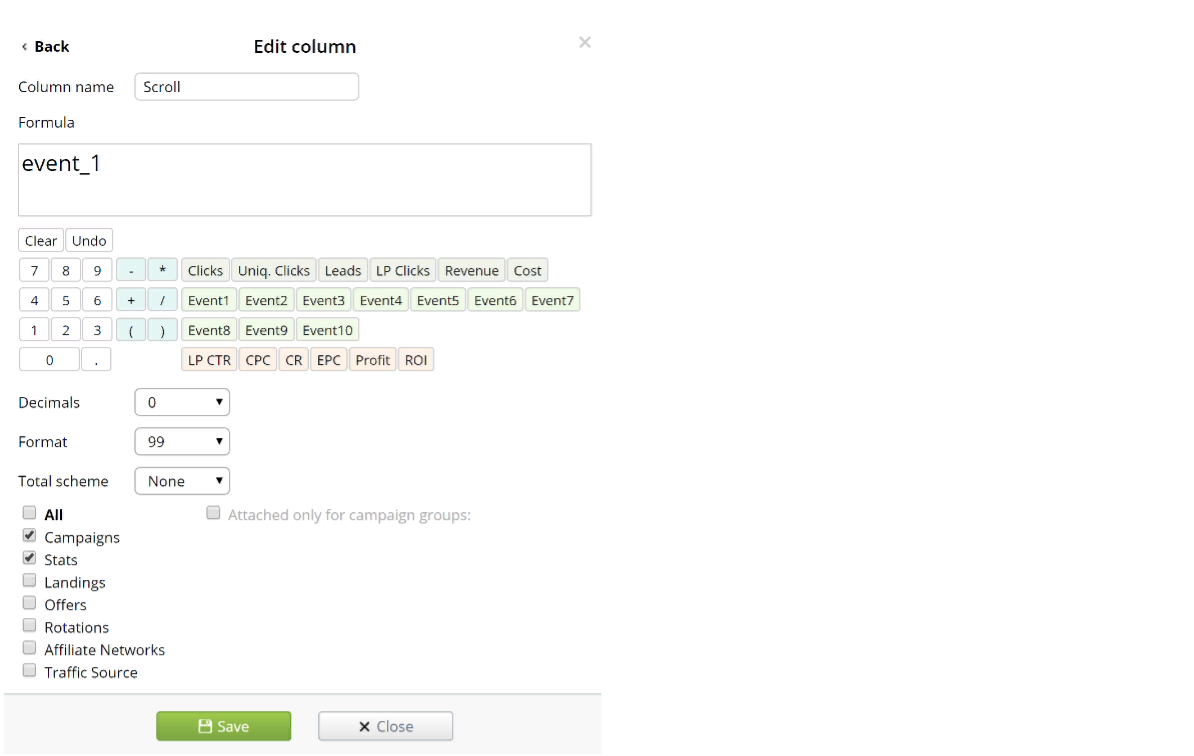
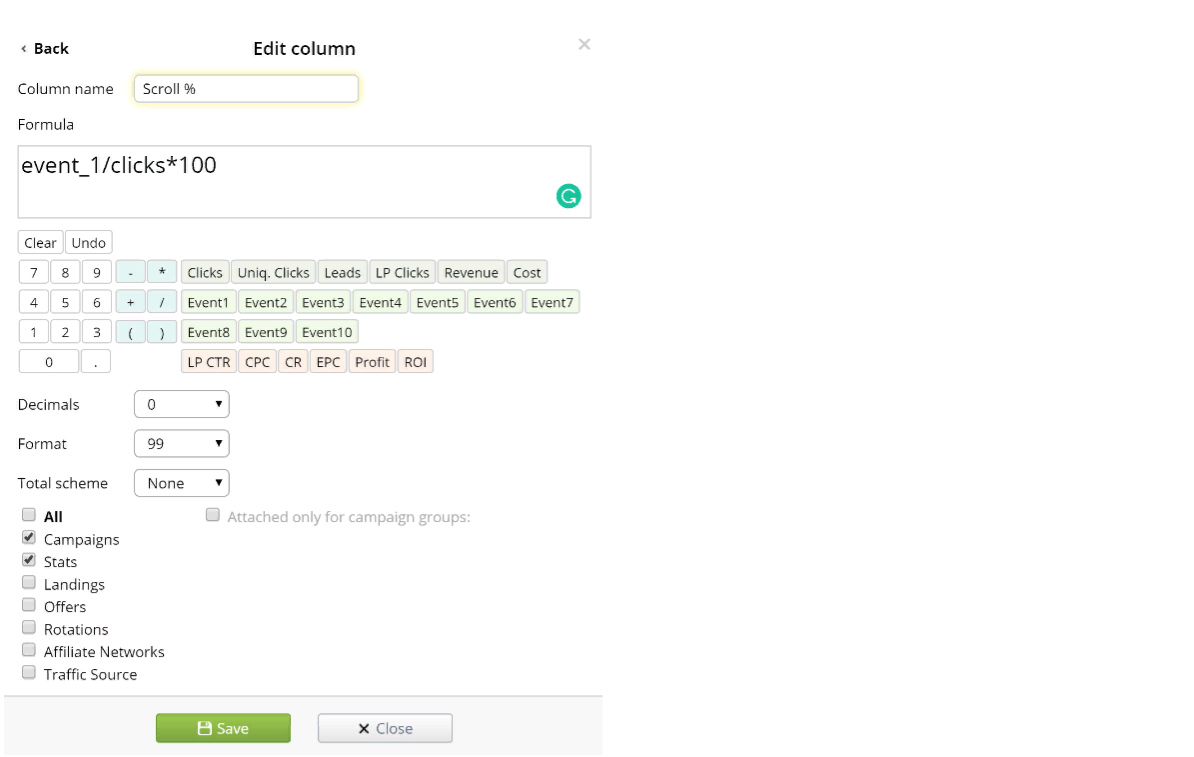
Scroll
Another gauge of engagement is scrolling. You can use this set up to determine if a visitor is actively scrolling your page. The more engaged a user is, the more likely they are to click through to your offer or buy your offer.
Here’s the script:
<script type=text/javascript>
var scroll = 0;
window.onscroll = function() {
if (scroll != 1) {
scroll = 1;
var o = document.createElement("img");
o.src = "https:// ##YOUR-TRACKING-LINK-HERE##.com/click.php?event1=1";
}
}
</script>
Here’s the column set up:
Converting it to the percentage is simple:
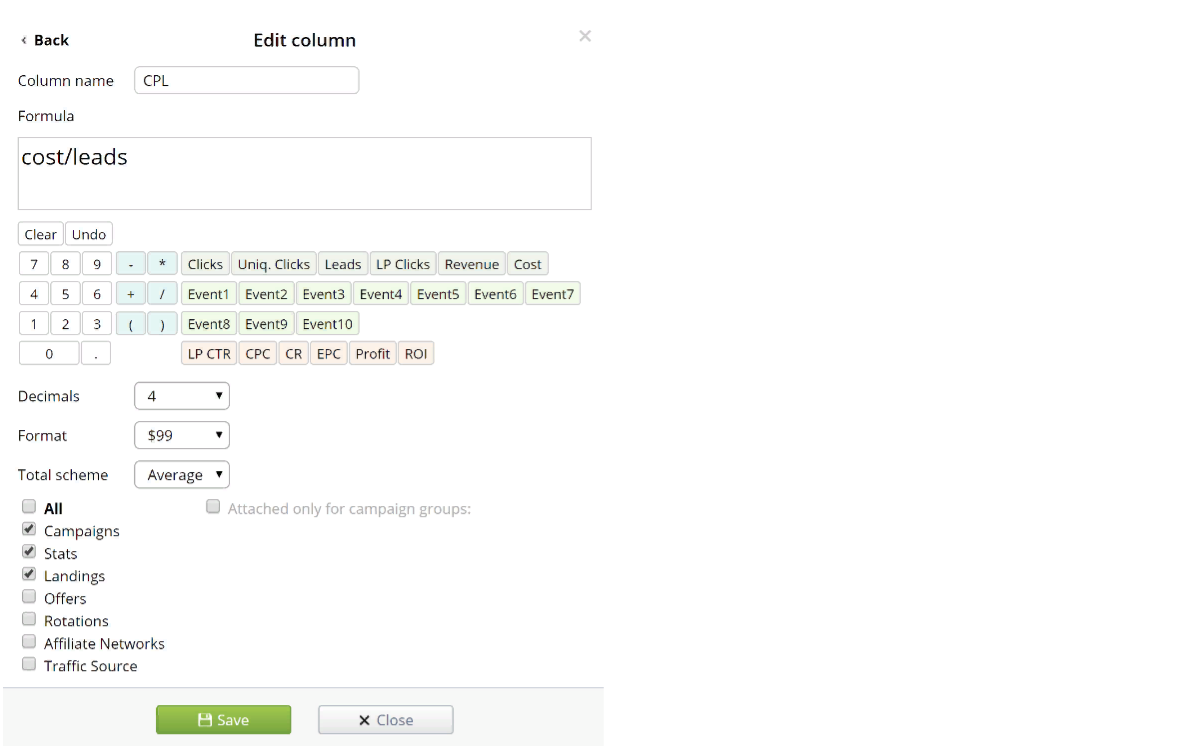
CPL
You can also set up a column to show how much it costs per one conversion.
Here’s the set up:
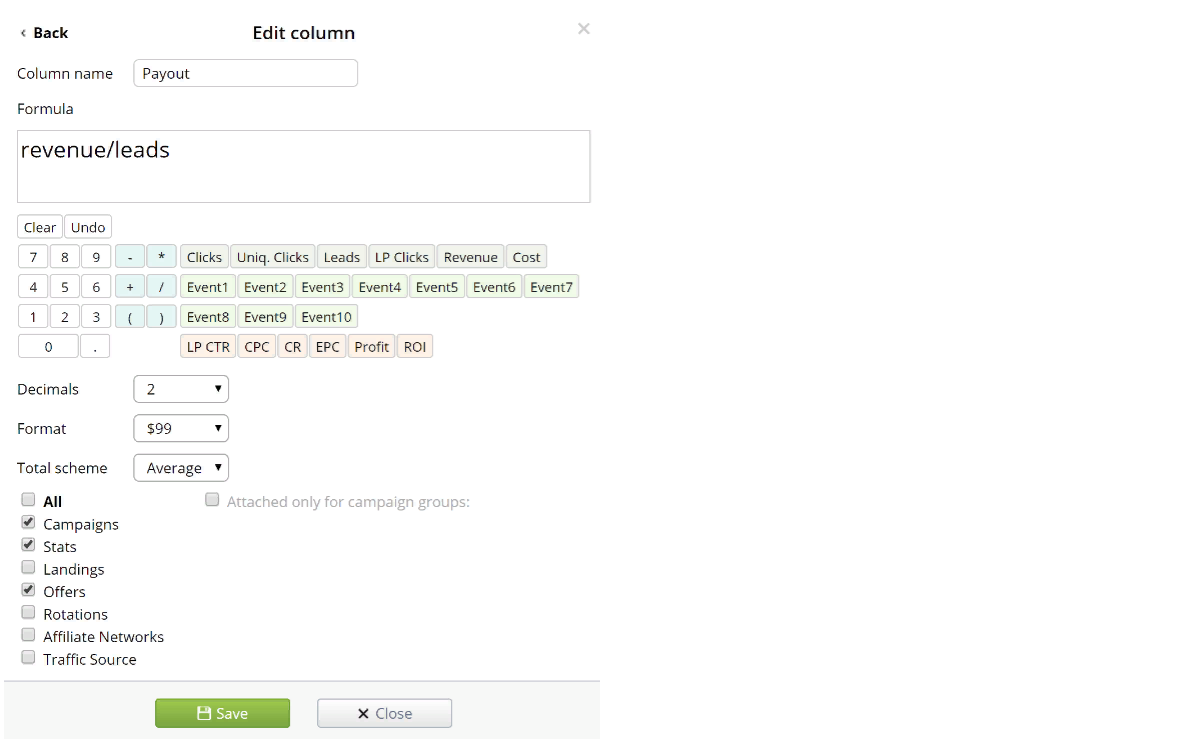
Payout
Often times, I start new campaigns testing multiple landers and offers and a lot of time, the payouts on the offers vary. A useful column to have is the payout column, which will calculate what the average payout for that campaign is.
If you’re advertising multiple offers, this column will take the average of all of the converted offers.
Note: This will show as 0 if there haven’t been any conversions
Here’s the setup:
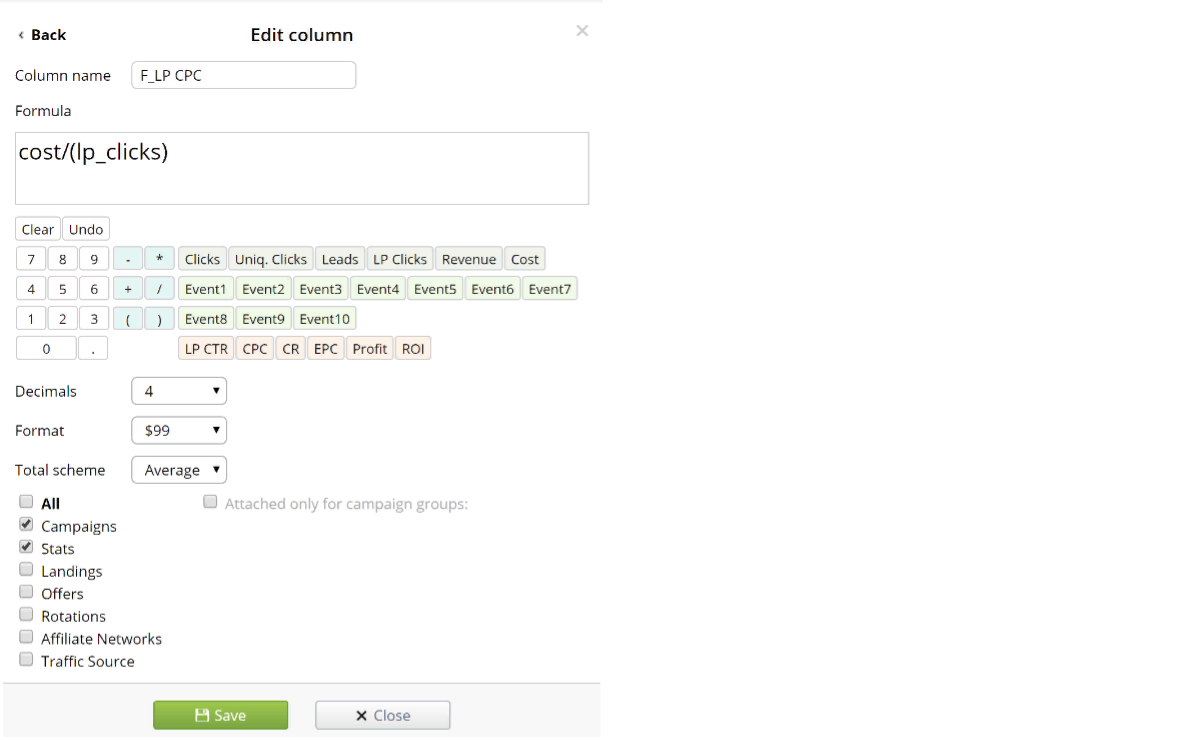
Cost / LP_click
Many of the affiliate networks have their own dashboard that give you certain stats on how well the offers that you are promoting perform. One of the most important metrics is the EPC, or earnings per click.
If you use landing pages, you can set up the cost per each click through to your offer using the following setup. That way, you can compare at a glance how well your offer is performing compared to your affiliate networks’ stats.
Here’s the column setup:
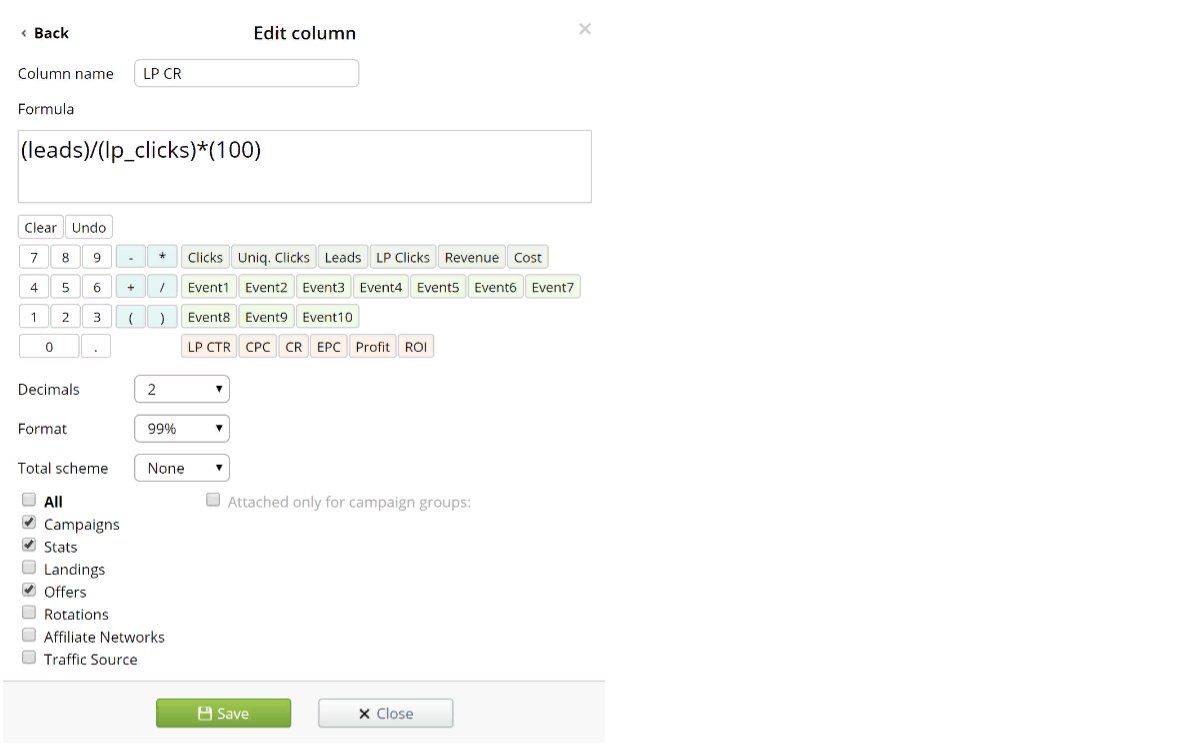
LP CVR
Another column I have set up is the offer’s conversion rate. For all of the visitors that click through to your offer, you can gauge how well your flow is working based on the number of landing page clicks compared to the number of conversions.
Some landing pages may not get as many click-throughs but if the flow works better with the offer, it could potentially convert much better. Alongside overall conversion rate, this column can help to gauge how well a flow is converting.
Here’s the column setup:
Summary
Affiliate marketing is a data-driven game. When you’re paying for traffic, you’re paying for data. Then, you can make decisions based on what is doing well and converting to decide on what to do next. In affiliate marketing, 1% change in stats could mean the difference between making $XXX per day or losing $XXX per day. Optimizing your campaigns so that they convert the best they possibly can is key to affiliate marketing.
Whether it’s the super accurate tracking, the ability to set Traffic Loss, the integrated landers, Binom is an invaluable resource for affiliate marketing. Its ability to be customized to your specific needs make it a must for any aspiring or veteran affiliate marketer.
How to Use Custom Columns in Binom to Set You Up for Success!
Getting started in affiliate or digital marketing? If you want to be successful in any form of online marketing, you need to be able to track and record the traffic you get so you can optimize your funnels.
Binom is hands down best tracker around. It’s highly customizable, provides superior tracking capabilities, giving accurate stats on all of your inbound traffic and, on top of it, their customer service is unrivalled.
One of the ways I’ve set up Binom to help me track my campaigns is set up custom columns on my dashboard. Doing this, I have quick access to important data, that I would otherwise not have access to or would take the extra time to calculate.
When you have 1 million+ clicks coming on your campaigns, every second counts. You don’t want to waste time doing something that you can have automated. Let Binom do the work for you!
Here are some of the additional columns I have set up for my Binom Dashboard.
You can find some of these columns in Binom’s documentation here:
"Binom Documentation / Система событий (Events)"
On top of those, I’ve added some others that have drastically helped me improve my performance:
CPL, or cost per lead; Payout to show how much the average conversion is worth in revenue; Cost per LP Click will show how much each click through will cost, which is very useful when comparing to your affiliate networks’ EPC; LP CVR, or landing page conversion rate, which can help gauge how well your flow is converting with the different landing pages you incorporate.
Bot %
<script>
if (typeof(window.orientation) == "undefined") {
var o = document.createElement("img");
o.src = 'https:// ##YOUR-TRACKING-LINK-HERE##.com/click.php?event9=0';
} else {
var o = document.createElement("img");
o.src = 'https://##YOUR-TRACKING-LINK-HERE##.com/click.php?event9=1';
} </script>
Here’s the column setup:
Time > 10s
Another indicator you can use to check engagement is how much time a visitor spends on your site. The longer someone spends on your site, the more likely they are to click through to your offer. I’ve set up a custom column to show how many users spend at least 10 seconds on my webpage.
Here’s the script:
<script>
function pushToTrackerViaImage() {
var pushURL = 'https:// ##YOUR-TRACKING-LINK-HERE##.com/click.php?event7=1';
var img = document.createElement('img');
img.src = pushURL;
img.style.display = 'none';
document.body.appendChild(img);
}
function pushAfterTimeout(timeout) {
setTimeout(pushToTrackerViaImage, timeout * 1000);
}
var TIMEOUT_IN_SECONDS = 10;
pushAfterTimeout(TIMEOUT_IN_SECONDS);
</script>
Once you set up the script, as long as the user can parse javascript, after they spend 10 seconds on your site, this script will send a ping back to your tracker. Then you can set up the custom column on your dashboard to gauge the engagement on your lander.
Here’s the custom column setup.
I’ve set it up using the event7 parameter:
If you just want to see the number of clicks, you can just include event_7.
Also, you can change the timeout from 10 seconds to longer or shorter by changing the TIMEOUT_IN_SECONDS variable.
Scroll
Another gauge of engagement is scrolling. You can use this set up to determine if a visitor is actively scrolling your page. The more engaged a user is, the more likely they are to click through to your offer or buy your offer.
Here’s the script:
<script type=text/javascript>
var scroll = 0;
window.onscroll = function() {
if (scroll != 1) {
scroll = 1;
var o = document.createElement("img");
o.src = "https:// ##YOUR-TRACKING-LINK-HERE##.com/click.php?event1=1";
}
}
</script>
Here’s the column set up:
Converting it to the percentage is simple:
CPL
You can also set up a column to show how much it costs per one conversion.
Here’s the set up:
Payout
Often times, I start new campaigns testing multiple landers and offers and a lot of time, the payouts on the offers vary. A useful column to have is the payout column, which will calculate what the average payout for that campaign is.
If you’re advertising multiple offers, this column will take the average of all of the converted offers.
Note: This will show as 0 if there haven’t been any conversions
Here’s the setup:
Cost / LP_click
Many of the affiliate networks have their own dashboard that give you certain stats on how well the offers that you are promoting perform. One of the most important metrics is the EPC, or earnings per click.
If you use landing pages, you can set up the cost per each click through to your offer using the following setup. That way, you can compare at a glance how well your offer is performing compared to your affiliate networks’ stats.
Here’s the column setup:
LP CVR
Another column I have set up is the offer’s conversion rate. For all of the visitors that click through to your offer, you can gauge how well your flow is working based on the number of landing page clicks compared to the number of conversions.
Some landing pages may not get as many click-throughs but if the flow works better with the offer, it could potentially convert much better. Alongside overall conversion rate, this column can help to gauge how well a flow is converting.
Here’s the column setup:
Summary
Affiliate marketing is a data-driven game. When you’re paying for traffic, you’re paying for data. Then, you can make decisions based on what is doing well and converting to decide on what to do next. In affiliate marketing, 1% change in stats could mean the difference between making $XXX per day or losing $XXX per day. Optimizing your campaigns so that they convert the best they possibly can is key to affiliate marketing.
Whether it’s the super accurate tracking, the ability to set Traffic Loss, the integrated landers, Binom is an invaluable resource for affiliate marketing. Its ability to be customized to your specific needs make it a must for any aspiring or veteran affiliate marketer.
Last edited:


")