





Most split tests run in this industry are theatre. Someone rotates two landers, checks after 150 clicks, sees lander B "winning" 8 conversions to 5, declares victory, and moves all traffic to B. Then B performs exactly like A did, because the "win" was a coin flip wearing a lab coat.
Here's the thing nobody wants to hear: at small sample sizes, random noise routinely produces differences that look decisive. Flip a coin 20 times and you'll regularly get 13–7. Nobody concludes the coin is biased. But show a media buyer 13 conversions vs 7 and they'll rebuild their whole funnel around it.
This guide covers three things: how to set the split up correctly in your tracker, how much traffic you actually need before the numbers mean anything (with a table, not a lecture), and the specific self-deceptions that ruin tests even when the setup is right. Plus a real test of mine that flipped its result completely between 200 and 2,000 clicks, which cured me of early peeking forever.
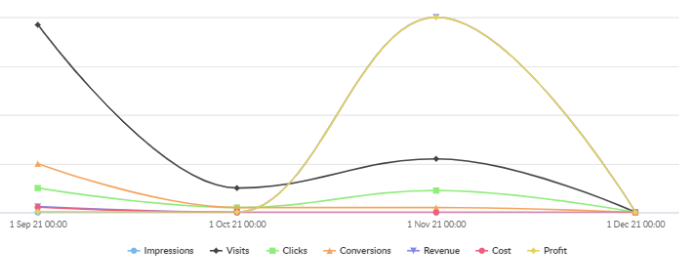
Use the tracker's rotation, nothing else. Every tracker (example; Bemob, Binom, Voluum, Keitaro, RedTrack) lets you add multiple landers to one campaign flow and assign weights. Set two landers at 50/50. The tracker randomly assigns each incoming click to one path and reports each lander's clicks, conversions and revenue separately. That's the entire mechanism.
What you must NOT do instead:
The iron rule underneath all three: the two landers must differ in exactly one way the lander. Same campaign, same source, same time window, same offer. The 50/50 random rotation is what guarantees both variants see the same mix of traffic.
One variable per test. If lander B has a new headline AND a new hero image AND a countdown timer, and it wins, what did you learn? Nothing you can reuse. You know that particular bundle beat the old bundle, but not why, so you can't apply the insight anywhere else. Test the headline. Then test the image. Slower, but every result teaches you a transferable fact. (The exception: testing two completely different lander concepts against each other as a first pass is fine - you're choosing a direction, not learning a variable. Just know which kind of test you're running.)
Set it up so conversions attribute correctly. Each lander gets its own click-through URL from the tracker so conversions map back to the right variant. Fire one test conversion through each path before spending. A split where one lander's tracking is silently broken produces a very confident, completely false winner.

(Ballpark figures at the standard 95% confidence / 80% power settings. good enough for buying decisions, no stats degree needed.)
Read that table and two practical truths fall out of it:
Truth 1: on a typical lander, small improvements are untestable for small buyers. If your CR is 3% and you want to detect a 10% relative lift, you need ~94,000 total clicks. At $0.01 push traffic that's a $940 test to detect a subtle improvement. Almost never worth it. Which leads to the actionable version: test big swings, not tweaks. A completely different angle, a different headline promise, a different page structure - changes that could plausibly move CR by 30–50%. Those confirm or die within a few thousand clicks. Button colours are for companies with a million visitors a day.
Truth 2: decide the sample size BEFORE you launch, and write it down. From the table: 3% CR, hoping for a big lift → roughly 2,000–4,000 clicks per variant. That's the finish line. Not "until it looks done." Not "until I get bored." The number, decided in advance, while you're calm.
And when the test hits the line, don't eyeball the result - put the four numbers (clicks and conversions per variant) into a free significance calculator. abtestguide.com/calc or SurveyMonkey's A/B calculator both work. It tells you the probability the difference is real. Above ~95%: trust it. Below: the honest answer is "no detectable difference," which is also a resul- it means keep the variant that's cheaper or easier and move your testing energy elsewhere.
Part 3: the self-deceptions
Setup can be perfect and the test still lies to you, because the weakest component is the person reading it. The classic failure modes:
Peeking and stopping early. The big one. You check daily (fine), and the moment your preferred variant pulls ahead, you call it (not fine). Random noise guarantees each variant will "lead" at various points along the way. If you stop whenever a lead looks exciting, you're not measuring the landers, you're measuring your own patience. The pre-committed sample size exists precisely to protect the test from you.
The novelty trap and its cousins. Day-one results are the least trustworthy of the whole test - new creative/lander combos sometimes get an unrepresentative first-day bounce from the traffic source. Related: don't start a test Friday and end it Monday; weekend traffic converts differently, and if one variant saw proportionally more weekend clicks (it happens with pauses and budget caps), the comparison is polluted. Cleanest practice: run whole weeks, or at least identical day-of-week coverage for both variants.
Changing things mid-test. You notice a typo on lander B on day two and fix it. Reasonable instinct, ruined test: the "B" in your final numbers is now two different pages averaged together. If a variant needs a change, restart its counter. Painful, but the alternative is a number that refers to nothing.
Survivorship in your memory. Run ten sloppy 200-click tests and a couple will produce thrilling false winners, which are the ones you'll remember and act on. The seven boring "no difference" results fade. This is how buyers end up with confident folklore ("red buttons crush it on sweeps") built entirely on noise. Log every test - variant, hypothesis, sample, result - in a sheet. Your logs will disagree with your memory, and your logs will be right.
Test that cured me
Sweeps(cpa model) pre-lander, push traffic, baseline CR around 4%. Variant A: the incumbent, "spin the wheel" framing. Variant B: new "answer 3 questions" quiz framing. One variable — the interaction concept. Pre-committed to 2,500 clicks per side, roughly following the table above.
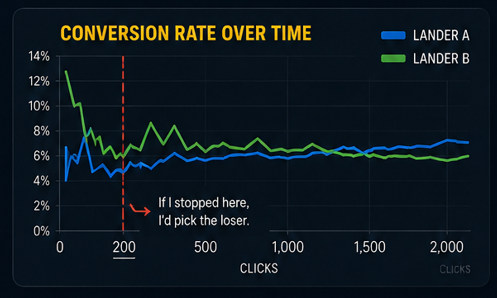
At ~200 clicks per variant: A had 11 conversions (5.5%), B had 5 (2.5%). A was "crushing it," a 2x difference. Old me would have killed B on the spot, and honestly my finger hovered.
At ~1,000 per variant: A at 4.6%, B at 4.1%. The gap had mostly evaporated. Interesting.
At 2,500 per variant (the line): A at 4.2% (105 conversions), B at 4.8% (121 conversions). B ahead. Calculator verdict: ~92% probability the difference was real — just under the threshold, so formally "promising, not proven." I extended to 4,000 per variant since traffic was cheap: B held at +13% relative, significance cleared 95%. B won.
The variant that was losing 2:1 at 200 clicks was the winner at 4,000. If I'd trusted the early read — the read that felt completely obvious — I'd have killed the better lander and never known. Since then, that memory does more for my testing discipline than any statistics lecture could.
That +13% CR lift, by the way, compounds through the whole funnel permanently, on every campaign that lander runs on. Which is why disciplined testing beats vibes-based lander shuffling: the wins are small-looking but they're real and they stack. The vibes wins are big-looking and imaginary.
Here's the thing nobody wants to hear: at small sample sizes, random noise routinely produces differences that look decisive. Flip a coin 20 times and you'll regularly get 13–7. Nobody concludes the coin is biased. But show a media buyer 13 conversions vs 7 and they'll rebuild their whole funnel around it.
This guide covers three things: how to set the split up correctly in your tracker, how much traffic you actually need before the numbers mean anything (with a table, not a lecture), and the specific self-deceptions that ruin tests even when the setup is right. Plus a real test of mine that flipped its result completely between 200 and 2,000 clicks, which cured me of early peeking forever.
Part 1: setting up the split correctly
The mechanics first, because a badly built split invalidates everything downstream.Use the tracker's rotation, nothing else. Every tracker (example; Bemob, Binom, Voluum, Keitaro, RedTrack) lets you add multiple landers to one campaign flow and assign weights. Set two landers at 50/50. The tracker randomly assigns each incoming click to one path and reports each lander's clicks, conversions and revenue separately. That's the entire mechanism.
What you must NOT do instead:
- Don't run two separate campaigns, one per lander. Different campaigns get different placements, different hours, different auction dynamics. You end up testing traffic differences, not lander differences.
- Don't test sequentially; lander A this week, lander B next week. Offers fluctuate, sources fluctuate, weekends differ from weekdays. Time is a variable, and sequential testing hands it a vote.
- Don't split across sources. A on push, B on pop tells you push differs from pop, which you already knew.
The iron rule underneath all three: the two landers must differ in exactly one way the lander. Same campaign, same source, same time window, same offer. The 50/50 random rotation is what guarantees both variants see the same mix of traffic.
One variable per test. If lander B has a new headline AND a new hero image AND a countdown timer, and it wins, what did you learn? Nothing you can reuse. You know that particular bundle beat the old bundle, but not why, so you can't apply the insight anywhere else. Test the headline. Then test the image. Slower, but every result teaches you a transferable fact. (The exception: testing two completely different lander concepts against each other as a first pass is fine - you're choosing a direction, not learning a variable. Just know which kind of test you're running.)
Set it up so conversions attribute correctly. Each lander gets its own click-through URL from the tracker so conversions map back to the right variant. Fire one test conversion through each path before spending. A split where one lander's tracking is silently broken produces a very confident, completely false winner.
Part 2: how much traffic do you actually need
Here's where everyone wants a single magic number, and the honest answer is: it depends on your conversion rate and on how big a difference you're trying to detect. Small differences need enormous samples. Big differences show up faster. But "it depends" isn't useful at 2am when you're staring at a campaign, so here is a practical reference table. It shows roughly how many clicks per variant you need to reliably detect a given relative improvement, at common lander conversion rates:
(Ballpark figures at the standard 95% confidence / 80% power settings. good enough for buying decisions, no stats degree needed.)
Read that table and two practical truths fall out of it:
Truth 1: on a typical lander, small improvements are untestable for small buyers. If your CR is 3% and you want to detect a 10% relative lift, you need ~94,000 total clicks. At $0.01 push traffic that's a $940 test to detect a subtle improvement. Almost never worth it. Which leads to the actionable version: test big swings, not tweaks. A completely different angle, a different headline promise, a different page structure - changes that could plausibly move CR by 30–50%. Those confirm or die within a few thousand clicks. Button colours are for companies with a million visitors a day.
Truth 2: decide the sample size BEFORE you launch, and write it down. From the table: 3% CR, hoping for a big lift → roughly 2,000–4,000 clicks per variant. That's the finish line. Not "until it looks done." Not "until I get bored." The number, decided in advance, while you're calm.
And when the test hits the line, don't eyeball the result - put the four numbers (clicks and conversions per variant) into a free significance calculator. abtestguide.com/calc or SurveyMonkey's A/B calculator both work. It tells you the probability the difference is real. Above ~95%: trust it. Below: the honest answer is "no detectable difference," which is also a resul- it means keep the variant that's cheaper or easier and move your testing energy elsewhere.
Part 3: the self-deceptions
Setup can be perfect and the test still lies to you, because the weakest component is the person reading it. The classic failure modes:
Peeking and stopping early. The big one. You check daily (fine), and the moment your preferred variant pulls ahead, you call it (not fine). Random noise guarantees each variant will "lead" at various points along the way. If you stop whenever a lead looks exciting, you're not measuring the landers, you're measuring your own patience. The pre-committed sample size exists precisely to protect the test from you.
The novelty trap and its cousins. Day-one results are the least trustworthy of the whole test - new creative/lander combos sometimes get an unrepresentative first-day bounce from the traffic source. Related: don't start a test Friday and end it Monday; weekend traffic converts differently, and if one variant saw proportionally more weekend clicks (it happens with pauses and budget caps), the comparison is polluted. Cleanest practice: run whole weeks, or at least identical day-of-week coverage for both variants.
Changing things mid-test. You notice a typo on lander B on day two and fix it. Reasonable instinct, ruined test: the "B" in your final numbers is now two different pages averaged together. If a variant needs a change, restart its counter. Painful, but the alternative is a number that refers to nothing.
Survivorship in your memory. Run ten sloppy 200-click tests and a couple will produce thrilling false winners, which are the ones you'll remember and act on. The seven boring "no difference" results fade. This is how buyers end up with confident folklore ("red buttons crush it on sweeps") built entirely on noise. Log every test - variant, hypothesis, sample, result - in a sheet. Your logs will disagree with your memory, and your logs will be right.
Test that cured me
Sweeps(cpa model) pre-lander, push traffic, baseline CR around 4%. Variant A: the incumbent, "spin the wheel" framing. Variant B: new "answer 3 questions" quiz framing. One variable — the interaction concept. Pre-committed to 2,500 clicks per side, roughly following the table above.
At ~200 clicks per variant: A had 11 conversions (5.5%), B had 5 (2.5%). A was "crushing it," a 2x difference. Old me would have killed B on the spot, and honestly my finger hovered.
At ~1,000 per variant: A at 4.6%, B at 4.1%. The gap had mostly evaporated. Interesting.
At 2,500 per variant (the line): A at 4.2% (105 conversions), B at 4.8% (121 conversions). B ahead. Calculator verdict: ~92% probability the difference was real — just under the threshold, so formally "promising, not proven." I extended to 4,000 per variant since traffic was cheap: B held at +13% relative, significance cleared 95%. B won.
The variant that was losing 2:1 at 200 clicks was the winner at 4,000. If I'd trusted the early read — the read that felt completely obvious — I'd have killed the better lander and never known. Since then, that memory does more for my testing discipline than any statistics lecture could.
That +13% CR lift, by the way, compounds through the whole funnel permanently, on every campaign that lander runs on. Which is why disciplined testing beats vibes-based lander shuffling: the wins are small-looking but they're real and they stack. The vibes wins are big-looking and imaginary.