



Czaq
Member
Why speed is a money problem, not a tech problem
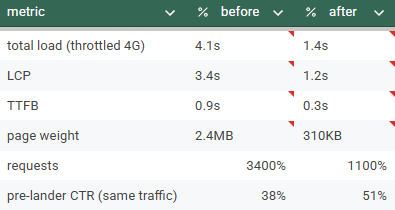
Before anything technical, the reason to care. Most paid traffic is mobile, and mobile users oncheap devices with average connections do not wait.Every second your lander spends loading, aslice of the clicks you already paid for bounces before seeing a single word. You paid for the clickeither way. A slow lander is literally you setting fire to a percentage of your ad budget before thefunnel even starts.Here’s the campaign this guide is built around, so the numbers have context. Push traffic, tier 2geo, mostly low-end Android devices, a sweeps flow with a pre-lander. The pre-lander loaded inabout 4.1 seconds on a simulated 4G connection. Ctr rate from pre-lander to offer sat at 38%. After the work documented below, the same page loaded in about 1.4 seconds and CTR onthe same traffic moved to 51%. Same page, same copy, same offer. The only thing that changedwas how fast it appeared.
First step: measure before you touch anything
The number one mistake is optimising blind. You need a baseline or you can’t prove anythingimproved.Two free tools, use both:
- PageSpeed Insights (pagespeed.web.dev) - gives you lab scores plus, crucially, Core WebVitals. Ignore the 0–100 score, it’s a distraction. Read the metrics.
- GTmetrix free tier - gives you the waterfall, which is the actual diagnostic tool. Set the testlocation as close to your traffic geo as the free tier allows, and set the connection to a throttledmobile profile, because testing on unthrottled fibre tells you nothing about your actual users.
The three numbers that matter:
TTFB - time to first byte, how fast your server answers -> needed: under 0.4s
LCP - largest contentful paint, when the main content is visible -> needed: under 2.0s
Total load - everything finished -> needed: under 1.5s for a lander
Write your baseline down. (Mine case was TTFB 0.9s, LCP 3.4s, total 4.1s. )
Step 1: read the waterfall like a media buyer
Open the GTmetrix waterfall. Every row is a file your page loads, every bar is how long it took.You’re looking for exactly three things:1. The longest bars. What single file takes the most time? Nine times out of ten it’s an image.
2. What loads before your content. Anything sitting above your hero image in the waterfall isdelaying it.
3. How many requests total. A lander should be lean. If you see 60+ requests on a one-pagelander, half of them are junk you inherited from a template.
My waterfall diagnosis, in order of damage:
- one hero image, 1.9MB uncompressed PNG - the single biggest problema
- full jQuery library (90KB) loaded to power one button animation
- three font families loaded from Google Fonts, of which the page used one
- tracker script loading synchronously in the head, blocking render
- no compression and no caching headers from the server at allSound familiar?
Step 2: images (this is 60% of your win)
Images are almost always the heaviest thing on a lander and the cheapest to fix.Compress and convert. Take every image through Squoosh (squoosh.app, free, in-browser). Convert to WebP at quality 75–80. My 1.9MB hero PNG came out at 142KB as WebP with no visible difference on a phone screen. That single file change removed 1.75MB from the page.
Resize to actual display size. The template shipped the hero at 2400px wide. It displays at most 800px wide on any phone. Serving triple the pixels is pure waste. Resize first, then compress.
Set explicit dimensions. Always give img tags width and height attributes. Without them thepage layout jumps around as images arrive, which both feels broken and hurts your CLS metric.
Lazy-load everything below the fold. One attribute, huge effect on initial load:

The hero image itself should NOT be lazy-loaded - it’s the first thing you want painted. Everythingbelow the first screen should be.
Step 3: kill render-blocking junk
Anything in your <head> that’s a synchronous script or a big stylesheet stops the browser frompainting until it’s downloaded. On a lander, almost nothing deserves that privilege.Drop jQuery entirely. The template used 90KB of jQuery for one scroll animation and a buttoneffect. Both took ten lines of vanilla JS. If your lander loads jQuery, it’s a template smell - removeit and rewrite the one or two things it did.
Inline your critical CSS. A lander’s entire stylesheet is usually tiny. Instead of an external CSS file(one more blocking request), paste the whole thing into a <style>
Fonts: use the system stack. Three Google Fonts families is three extra requests plus a flash ofinvisible text on slow connections. On a lander nobody is admiring your typography. This costs zerorequests and looks native on every device:

If a specific display font truly is part of the creative, keep exactly one, self-host the woff2, andpreload it.Defer the tracker script. Your tracking must fire, but it must not block paint. Move tracker JS toload defer or async (check your tracker’s docs, most support it):

The click-through URL fallback still works even in the rare case the script is slow, and your pagepaints immediately. Test a click end-to-end in your tracker after this change, always.After this step: 2.3s down to about 1.7s, and the page now feels instant because the first painthappens fast even before total load finishes.
Final step 4: server-side, ten minutes of nginx config
If you self-host on a VPS, two server changes finish the job. Both go in your nginx config.
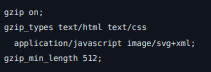
Enable gzip compression. Your HTML, CSS and JS shrink 70–80% over the wire:
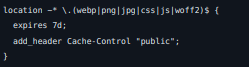
Cache static assets. Repeat visitors (and every navigation within the flow) load images andscripts from the browser cache instead of your server:
Reload nginx ( nginx -t && systemctl reload nginx ) and re-test. My TTFB also dropped from 0.9s to0.3s here - turned out the droplet was in a US region while the traffic was European. Moving theVPS to a region near the traffic geo, or putting free-tier Cloudflare in front, fixes geographic TTFB. Ifyour TTFB is high and your server is far from your users, no amount of front-end work will hide it.
Final numbers: